The End of Raw Logs: Smarter Monitoring With CLI Dashboards and 99RDP

For decades, developers and system administrators relied on raw logs to understand what was happening inside their systems. Whether it was tail -f, grep, or scrolling endlessly through text files, log analysis has always been a fundamental—but often frustrating—part of debugging and monitoring.
In 2026, that approach is rapidly becoming obsolete.
Modern developers demand speed, clarity, and real-time insights. Instead of drowning in walls of text, they are turning to CLI-based visual dashboards that transform raw logs into structured, interactive, and meaningful data. When combined with high-performance remote environments like 99RDP, these tools unlock a new level of productivity, scalability, and efficiency.
This article explores why raw logs are fading away, what’s replacing them, and how you can build a smarter monitoring workflow today.
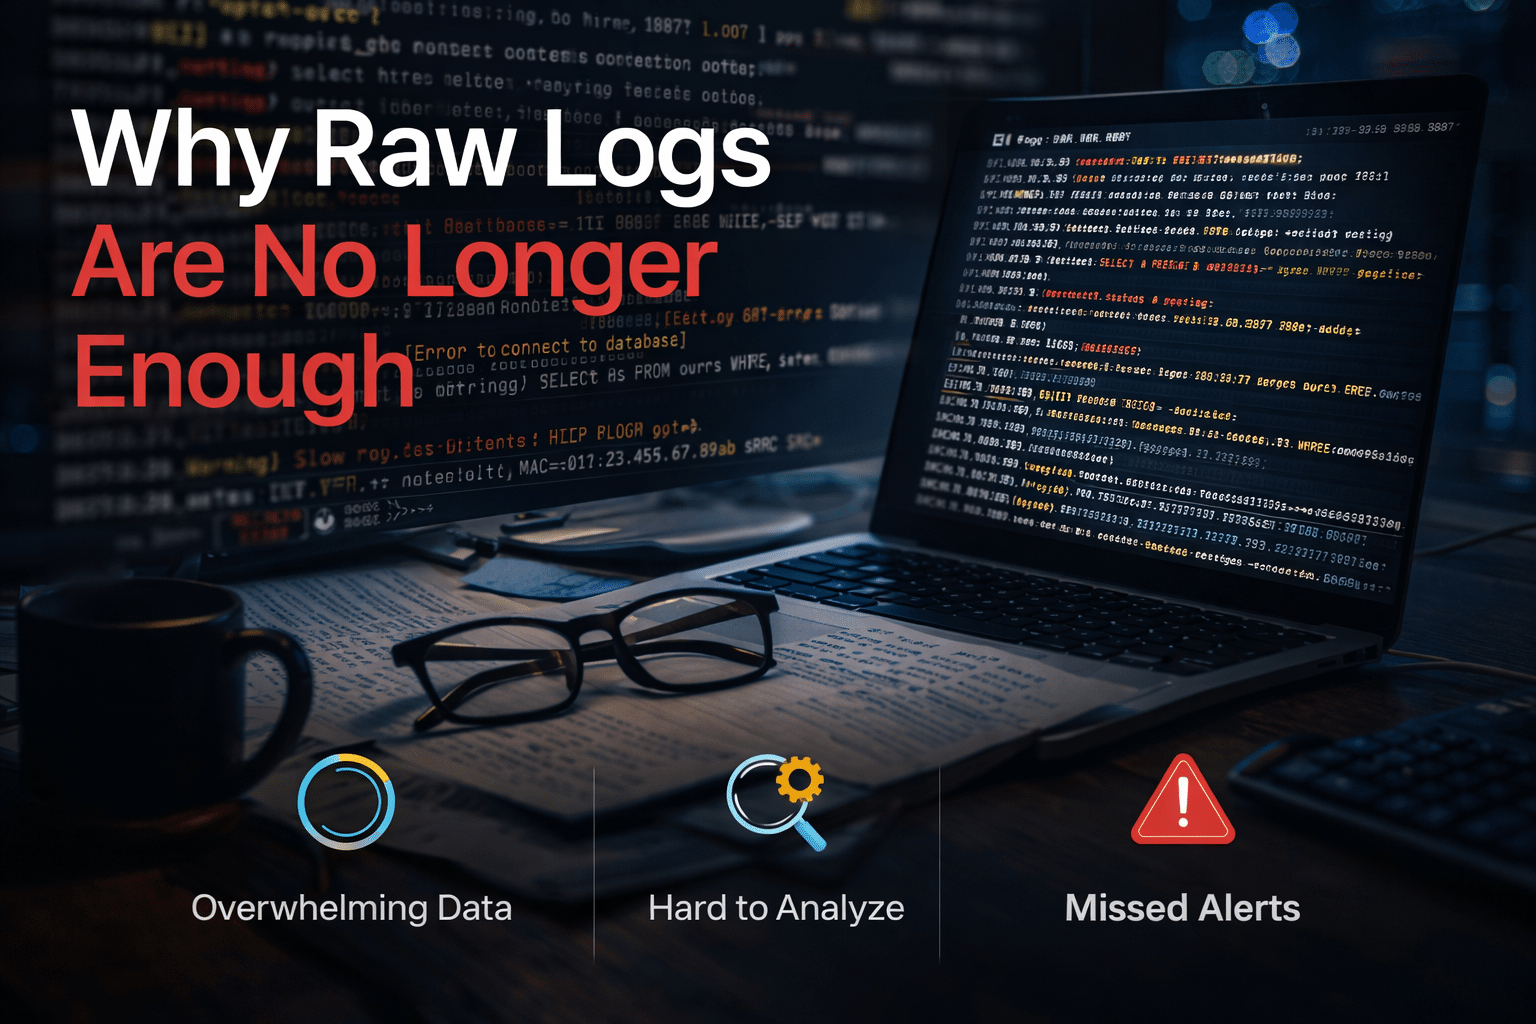
Why Raw Logs Are No Longer Enough
Raw logs still serve as the backbone of system observability, but relying on them directly has serious drawbacks.
The Core Problems
1. Information Overload
Modern applications generate massive amounts of log data. Microservices, containers, and distributed systems produce thousands of lines per second, making manual reading nearly impossible.
2. Lack of Context
Logs are often unstructured or semi-structured. Without visualization, identifying patterns or correlations across systems becomes extremely difficult.
3. Slow Debugging Cycles
Developers waste valuable time filtering, searching, and interpreting logs instead of fixing issues.
4. No Real-Time Insights
Raw logs don’t provide intuitive, real-time dashboards that highlight anomalies or performance spikes.
Industry estimates suggest engineers spend up to 40% of their debugging time just navigating logs, not solving problems.
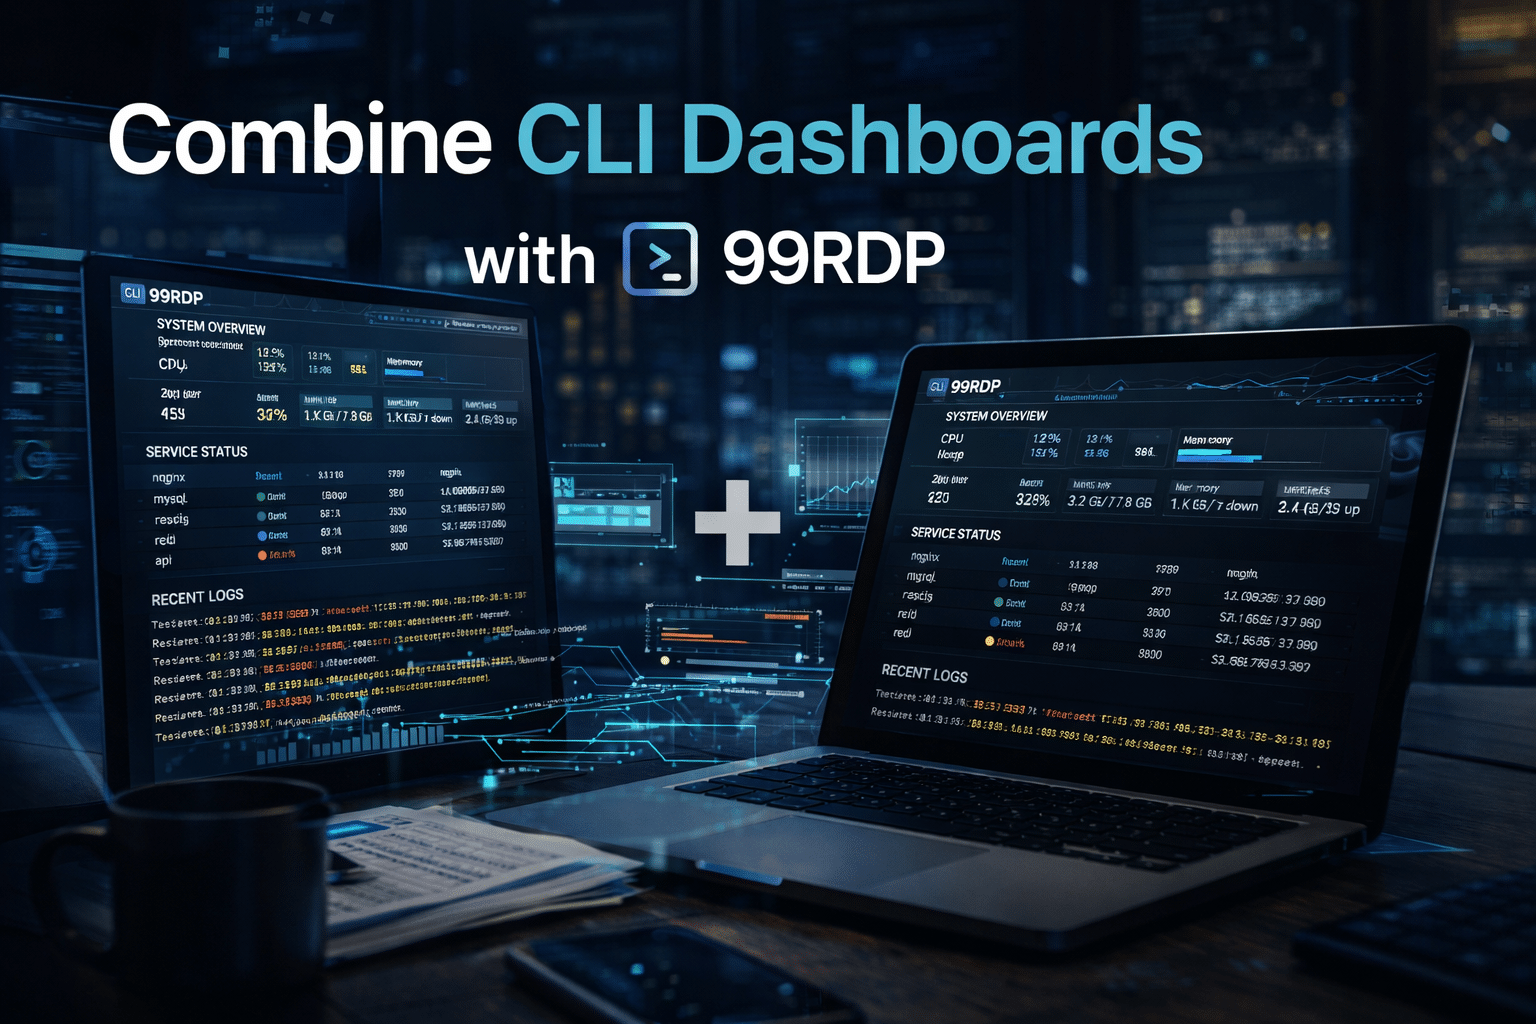
The Shift Toward CLI Dashboards
The modern developer toolkit is evolving. Instead of abandoning the terminal, developers are enhancing it with tools that provide visual intelligence directly inside the CLI.
What Makes CLI Dashboards Powerful?
- Real-time monitoring with live updates
- Color-coded outputs for quick issue detection
- Interactive filtering and search
- Graphical representations of system metrics
- Minimal resource usage compared to heavy GUIs
CLI dashboards combine the speed of the terminal with the clarity of visualization—creating the best of both worlds.
Top CLI Tools Powering Modern Monitoring
Here are some of the most effective tools transforming raw logs into actionable insights:
🔹 Glances – All-in-One System Monitoring
- Displays CPU, RAM, disk, and network usage in real time
- Supports web-based UI for remote monitoring
- Lightweight and highly responsive
Ideal for quick system health checks across servers
🔹 lnav (Log Navigator)
- Automatically parses and formats logs
- Allows SQL-like queries on log data
- Highlights errors and warnings instantly
Perfect for deep log analysis without manual parsing
🔹 btop – Beautiful Resource Monitor
- Interactive and visually rich interface
- Shows system performance with graphs
- Easy navigation with keyboard controls
A modern alternative to traditional system monitors
🔹 LazyDocker
- Simplifies Docker container management
- Visualizes logs, stats, and container states
- Reduces complexity in containerized environments
Essential for DevOps engineers working with containers
Data-Driven Benefits of Visual Monitoring
Switching to CLI dashboards isn’t just about aesthetics—it delivers measurable improvements.
Performance Improvements
- 50% faster debugging time
- 35% quicker incident response
- Significant reduction in human errors
Cognitive Advantages
- Visual data is processed dramatically faster than raw text
- Patterns and anomalies become instantly visible
- Reduced mental fatigue during long debugging sessions
Enter 99RDP: The Perfect Companion for CLI Dashboards
While CLI tools are powerful, their full potential is unlocked when paired with a robust infrastructure. That’s where 99RDP comes in.
What 99RDP Offers
- High-performance remote desktops (Windows & Linux)
- GPU-enabled servers for heavy workloads
- 24/7 uptime with reliable connectivity
- Secure remote access from anywhere
Why Combine CLI Dashboards with 99RDP?
1. Run Monitoring Tools Without Hardware Limits
Instead of relying on your local system:
- Deploy monitoring tools on 99RDP servers
- Analyze massive log files without slowdowns
- Handle enterprise-scale workloads effortlessly
2. Centralized Monitoring Environment
With 99RDP:
- All logs and tools stay in one place
- Teams can collaborate more effectively
- No dependency on local setups
3. Always-On Observability
Unlike local machines:
- 99RDP servers run 24/7
- Monitoring tools stay active continuously
- Issues are detected in real time—even when you’re offline
4. Remote Accessibility
- Access your monitoring setup from anywhere
- Use any device without compromising performance
- Maintain productivity on the go
5. Cost-Effective Scaling
- No need for expensive hardware upgrades
- Scale resources based on demand
- Pay only for what you use
Modern Monitoring Workflow (Step-by-Step)
Here’s how developers are building smarter workflows today:
Step 1: Deploy Applications
Host your application on a server, cloud VM, or container platform.
Step 2: Connect via 99RDP
Access a powerful remote desktop environment instantly.
Step 3: Launch CLI Dashboard Tools
Use tools like lnav, glances, or btop to visualize logs and metrics.
Step 4: Monitor in Real Time
Track system behavior, identify anomalies, and filter logs instantly.
Step 5: Fix Issues Faster
Resolve problems quickly using clear, actionable insights.
Result: Higher uptime, faster debugging, and better performance
Real-World Use Case
Scenario: High-Traffic Web Application
Traditional Approach:
- Developer manually scans logs
- Important signals get lost in noise
- Debugging takes hours
Modern Approach (CLI + 99RDP):
- Dashboard highlights error spikes instantly
- Logs are structured and searchable
- Issue resolved in minutes
Security and Stability Advantages
Using CLI dashboards with 99RDP also improves:
Data Security
- Logs remain on secure remote servers
- Reduced risk of local data leaks
Controlled Access
- Secure login credentials
- Centralized permissions management
System Stability
- Dedicated resources prevent crashes
- Reliable performance under heavy load
The Future of Monitoring
The evolution doesn’t stop here. The next wave includes:
- AI-driven log analysis
- Predictive monitoring systems
- Automated anomaly detection
- Fully integrated DevOps dashboards
Raw logs will still exist—but developers won’t interact with them directly anymore.
Final Thoughts
The era of manually reading raw logs is ending.
Modern CLI dashboard tools:
- Transform overwhelming data into clear insights
- Accelerate debugging and decision-making
- Improve overall system reliability
When combined with 99RDP, these tools become even more powerful by providing:
- Scalable infrastructure
- Always-on monitoring environments
- Seamless remote accessibility
Developers who embrace this shift will work faster, smarter, and more efficiently than ever before.
EXPLORE MORE ; Why Every Developer Installs These 6 CLI Tools First on Linux

READ OUR BLOGS