Monitoring your servers is critical for maintaining performance, detecting failures, and ensuring uptime. One of the most powerful and flexible open-source monitoring stacks today is Grafana + InfluxDB. This combination allows you to collect, store, and visualize time-series data from your servers in beautiful dashboards.
In this blog, we’ll walk through the basics of setting up InfluxDB and Grafana to monitor server metrics like CPU, memory, disk usage, and network traffic.
🔧 Step-by-Step Guide
1. Install InfluxDB
InfluxDB is a time-series database designed to store high-volume metrics. You can install it via package manager:
Ubuntu/Debian: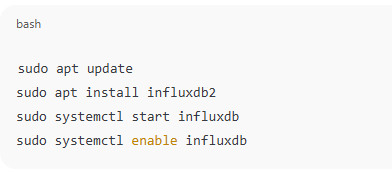
sudo apt update
sudo apt install influxdb2
sudo systemctl start influxdb
sudo systemctl enable influxdb
Visit http://localhost:8086 to complete the setup (create user, bucket, org, and get your token).
2. Install Telegraf (Agent to Collect Metrics)
Telegraf is InfluxData’s agent that collects metrics from your system and sends them to InfluxDB.
sudo apt install telegraf
Edit the config at /etc/telegraf/telegraf.conf, and under the output plugin section, add your InfluxDB 2.0 details:
[[outputs.influxdb_v2]]
  urls = ["http://localhost:8086"]
  token = "YOUR_TOKEN"
  organization = "YOUR_ORG"
  bucket = "YOUR_BUCKET"
Start Telegraf:
sudo systemctl start telegraf
sudo systemctl enable telegraf
3. Install Grafana

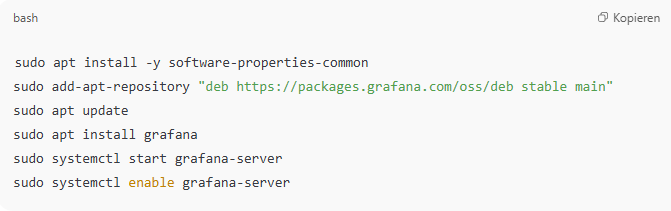
sudo apt install -y software-properties-common
sudo add-apt-repository "deb https://packages.grafana.com/oss/deb stable main"
sudo apt update
sudo apt install grafana
sudo systemctl start grafana-server
sudo systemctl enable grafana-server
Open your browser to http://localhost:3000 (default user: admin/admin).
4. Connect InfluxDB to Grafana
- In Grafana, go to Settings > Data Sources > Add data source.
- Choose InfluxDB.
- Set:
- URL:
http://localhost:8086 - Token: Your InfluxDB API token
- Organization: Your Org
- Default Bucket: Your Bucket
- URL:
Click Save & Test.
5. Create Dashboards
Now that Grafana is connected:
- Go to Dashboards > New > Add Query.
- Use the InfluxQL or Flux language to select metrics like:
cpu_usagemem_used_percentdisk_freenet_bytes_sent
Grafana will plot real-time charts, graphs, and alerts as needed.
✅ Why Use Grafana + InfluxDB?
- Open-source: No cost for basic usage.
- Flexible Dashboards: Real-time data visualization.
- Scalable: Efficient for handling large time-series datasets.
- Integration-ready: Supports many plugins and exporters.
How to Use Grafana + InfluxDB for Server Metrics (F.A.Q)
What is Telegraf used for?
Telegraf is an agent that collects server metrics and sends them to InfluxDB.
Is InfluxDB better than Prometheus?
InfluxDB is more efficient for long-term data storage and built-in downsampling, while Prometheus is ideal for short-term alerting.
Can I use Grafana without InfluxDB?
Yes, Grafana supports many data sources, including Prometheus, MySQL, Loki, and more.
Does Grafana have alerting features?
Yes, Grafana allows alerting based on thresholds, integrations with email, Slack, etc.