
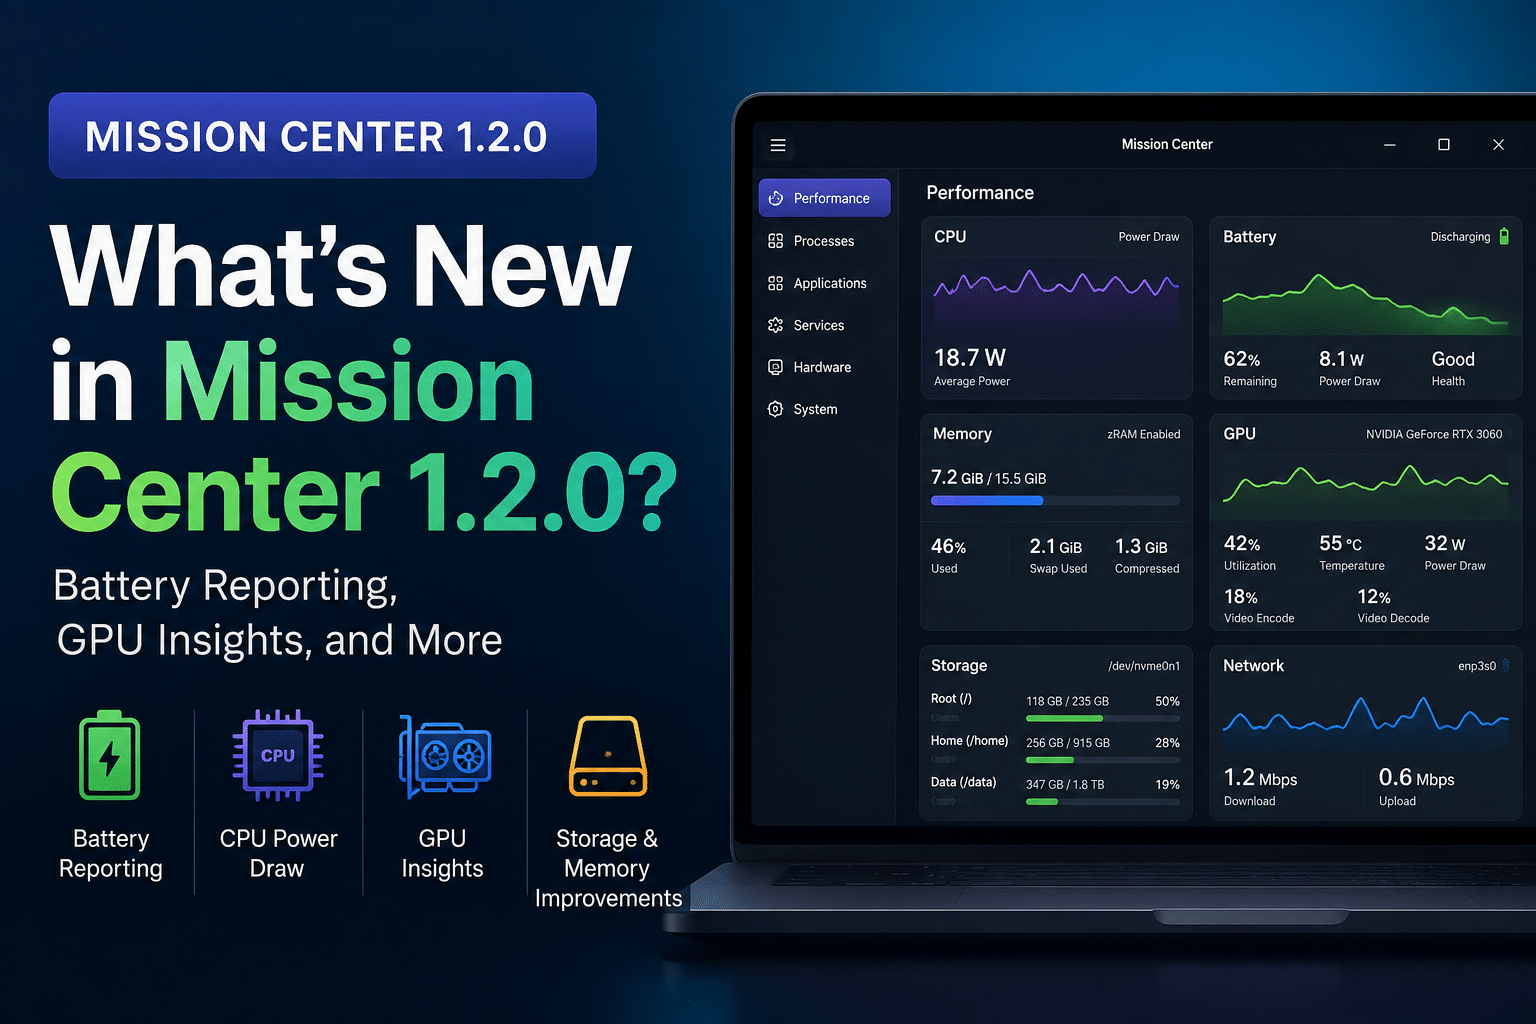
What’s New in Mission Center 1.2.0? Battery Reporting, GPU Insights, and More
Linux users have never had more choices when it comes to monitoring system performance. From traditional command-line tools like top, htop, and iostat to graphical applications such as GNOME System Monitor, KDE System Monitor, and Mission Center, every user can choose a solution that matches their workflow. However, as Linux desktops become more polished and modern, expectations have changed. Users now want a monitoring application that combines detailed hardware metrics, intuitive visualizations, and a clean interface without sacrificing performance.
Mission Center has quickly emerged as one of the most promising system monitoring tools for Linux. Designed with a modern GTK4 interface and optimized for Wayland and contemporary desktop environments, it presents real-time performance data in an easy-to-understand dashboard. Instead of overwhelming users with complex command-line outputs, Mission Center focuses on clear graphs, responsive updates, and actionable information.
The release of Mission Center 1.2.0 marks another significant milestone in the application’s evolution. Rather than introducing cosmetic changes alone, this version expands its monitoring capabilities with battery reporting, CPU power draw metrics, improved GPU statistics, richer memory information, enhanced storage reporting, and numerous performance optimizations. These additions make Mission Center more useful for laptop users, developers, system administrators, and anyone who wants better visibility into their Linux system.
According to the project announcement highlighted by OMG! Ubuntu, the new release adds one of the most requested features—battery monitoring—while refining the application’s performance and expanding support for modern hardware. Together, these improvements position Mission Center as a compelling alternative to older system monitoring utilities.
Why Modern Linux Monitoring Matters
Today’s Linux systems perform a wide variety of demanding tasks, including:
- Software development
- Virtual machine hosting
- AI model experimentation
- Video editing
- Gaming
- Content creation
- Container orchestration
- Remote server management
Each workload places different demands on the CPU, GPU, memory, storage, and power subsystem.
A modern monitoring application helps users answer questions such as:
- Why is my laptop battery draining quickly?
- Which application consumes the most CPU resources?
- Is my GPU actually being utilized?
- Am I running out of RAM or swap?
- Which disk partition is approaching full capacity?
- Is thermal throttling affecting performance?
Mission Center brings these answers together in a single interface, reducing the need to switch between multiple command-line utilities or desktop applications.
A Brief Look at Mission Center
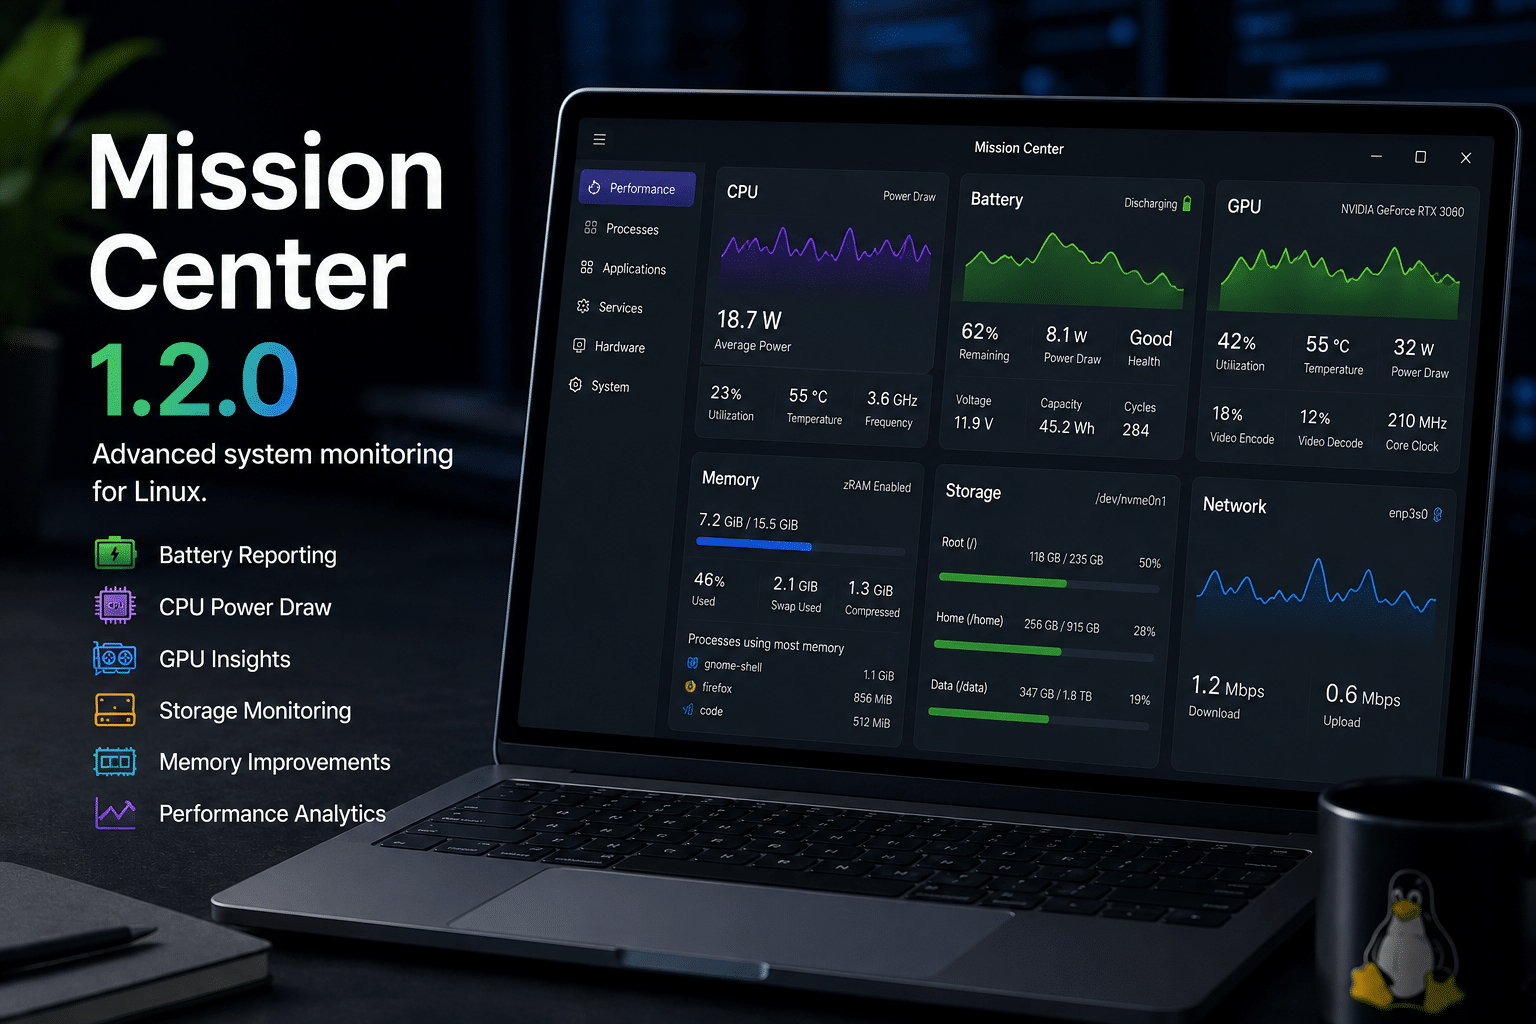
Mission Center is a graphical Linux system monitor developed with simplicity and performance in mind. Built using GTK4 and Libadwaita, it integrates naturally with modern GNOME-based desktops while remaining compatible with other Linux desktop environments.
Unlike traditional system monitors that focus primarily on process lists, Mission Center emphasizes visual analytics. Live graphs, hardware utilization charts, and organized performance tabs make it easier to understand how different system components behave over time.
Key monitoring areas include:
- CPU utilization
- Memory usage
- GPU activity
- Storage performance
- Network traffic
- Running applications
- System services
- Hardware sensors
With version 1.2.0, this feature set expands significantly.
What’s New in Mission Center 1.2.0?
Mission Center 1.2.0 introduces several practical enhancements that improve both functionality and user experience.
Some of the biggest additions include:
- Dedicated battery monitoring
- CPU power draw reporting
- Partition-level storage statistics
- Improved GPU analytics
- Enhanced memory reporting
- Better hardware compatibility
- Faster graph rendering
- Smaller AppImage packages
- Updated Snap packaging
- Numerous bug fixes
Rather than adding features for the sake of feature parity, each improvement addresses real-world monitoring needs.
For example, laptop users can now visualize battery behavior throughout the day, while developers can observe how demanding workloads affect processor power consumption.
Similarly, users working with hardware acceleration can better understand GPU encode and decode activity without relying on vendor-specific utilities.
Mission Center Is Evolving Beyond a Simple Task Manager
Many Linux users still rely on GNOME System Monitor or KDE System Monitor because these applications ship by default with their desktop environments.
Mission Center takes a different approach.
Instead of presenting only lists and percentages, it focuses on helping users understand trends.
For example, rather than merely displaying that CPU usage has reached 85%, Mission Center allows users to visualize how usage changed over the last several minutes. The same philosophy now extends to battery discharge, GPU utilization, storage usage, and memory compression.
This makes identifying performance bottlenecks much easier.
For developers compiling large applications, content creators rendering videos, or system administrators monitoring server workloads, historical graphs provide significantly more context than static values.
Why This Release Is Important
Version 1.2.0 demonstrates that Mission Center is maturing into a professional-grade monitoring application.
The addition of battery reporting addresses one of the biggest gaps in previous releases.
Meanwhile, CPU power draw reporting introduces an entirely new dimension of system analysis.
Instead of simply knowing that a processor is busy, users can now understand how much electrical power it consumes under different workloads.
This information is particularly valuable for:
- Mobile developers
- Laptop users
- Performance tuners
- Benchmark enthusiasts
- Linux hardware reviewers
- Energy-conscious organizations
As energy efficiency becomes increasingly important across desktops, laptops, and edge devices, tools capable of exposing detailed power metrics become essential rather than optional.

Mission Center and Modern Remote Workflows
Many professionals today split their workloads between local Linux desktops and cloud-hosted virtual machines. A developer might write and test code on a Linux laptop while running Windows-only applications, build environments, or long-running automation tasks on a remote server.
This hybrid workflow is where a reliable remote infrastructure provider such as 99RDP fits naturally. Instead of relying solely on local hardware, developers can use a Windows VPS to host integrated development environments, productivity software, remote browsers, or continuous testing environments that remain available around the clock. Meanwhile, Mission Center provides detailed insight into the health and performance of the local Linux workstation, helping users optimize battery life, CPU usage, and overall system efficiency.
By combining intelligent local monitoring with dependable remote computing resources, professionals can create a flexible workflow that balances portability, performance, and uptime without constantly upgrading their personal hardware.
A Deep Dive into Mission Center 1.2.0’s Biggest Features
The headline features in Mission Center 1.2.0 are more than incremental improvements. They reflect how Linux desktop monitoring is evolving to meet the needs of developers, creators, gamers, and enterprise users. Instead of relying on multiple utilities to monitor different hardware components, users can now access a broader range of performance data from a single, modern interface.
Let’s examine the most significant additions in detail.
1. Battery Reporting: A Long-Awaited Feature
Battery monitoring is arguably the biggest addition in Mission Center 1.2.0.
Previous versions provided excellent CPU, GPU, memory, and storage information but lacked a dedicated battery dashboard. Laptop users often had to rely on command-line tools like upower, desktop battery indicators, or separate applications to understand battery health.
Mission Center now brings this information directly into its Performance section.
The new Battery page provides:
- Current battery percentage
- Charging or discharging status
- Battery health
- Remaining capacity
- Voltage
- Energy measured in watt-hours (Wh)
- Charge thresholds (where supported)
- Historical battery graphs
Instead of simply displaying a percentage, Mission Center visualizes how the battery behaves over time. This historical perspective helps users identify abnormal discharge patterns, sudden power spikes, or gradual battery degradation.
For professionals who spend hours away from a power outlet, this visibility can make a significant difference in managing productivity.
Why Battery Health Matters
Laptop batteries naturally degrade with age. After hundreds of charge cycles, they lose the ability to hold their original capacity.
For example:
- A new 60 Wh battery stores approximately 60 watt-hours of energy.
- After years of use, it may only retain 45–50 Wh.
- Reduced capacity leads to shorter battery life, even if the battery indicator still reaches 100%.
Mission Center exposes these metrics in a way that makes long-term health easier to understand.
Instead of wondering why battery life has declined, users can verify whether the battery itself has deteriorated or whether software is consuming excessive power.
Practical Battery Monitoring Scenarios
Battery reporting benefits a wide range of users.
Developers can compare battery consumption while compiling large projects.
Students can identify applications draining power during lectures.
Content creators can estimate how long video editing sessions will last on battery power.
IT administrators can monitor battery health across Linux laptops before failures occur.
These insights reduce guesswork and encourage proactive maintenance.
2. CPU Power Draw Reporting
CPU utilization has always been an important metric, but utilization alone does not tell the complete story.
A processor operating at 50% utilization may consume significantly different amounts of power depending on:
- Clock frequency
- Turbo Boost
- Core count
- Instruction set usage
- Cooling efficiency
Mission Center 1.2.0 introduces CPU Power Draw reporting, allowing users to measure actual processor energy consumption when supported by their hardware.
Users can switch the CPU graph between:
- Utilization
- Frequency
- Temperature
- Power Draw
This flexibility transforms Mission Center into a more comprehensive performance analysis tool.
Why CPU Power Matters
Power consumption influences several critical factors:
- Battery life
- Heat generation
- Fan noise
- Thermal throttling
- Electricity costs
Consider two software builds.
Both may finish in the same amount of time.
However, one compiler configuration might consume 18 watts while another uses 28 watts.
Over hundreds of development sessions, those differences affect battery runtime and system temperatures.
Mission Center makes these differences visible.
Developers Gain Better Performance Insights
Developers frequently execute demanding workloads:
- C++ compilation
- Android builds
- Docker containers
- Kubernetes clusters
- Virtual machines
- AI inference
- Video encoding
Monitoring CPU power draw helps answer questions such as:
- Which compiler settings consume less energy?
- Does enabling parallel builds increase power significantly?
- Are background applications affecting battery life?
- Is thermal throttling reducing performance?
Instead of relying on assumptions, developers can observe measurable behavior.
3. Richer GPU Monitoring
Graphics processors have become essential across many Linux workloads.
Modern GPUs accelerate:
- Gaming
- Video rendering
- Machine learning
- AI inference
- Web browsers
- Streaming
- 3D design
- Scientific computing
Mission Center already displayed GPU utilization.
Version 1.2.0 expands this capability considerably.
Depending on hardware support, users can monitor:
- GPU utilization
- Video Encode activity
- Video Decode activity
- Temperature
- Core frequency
- Power usage
- VRAM utilization
This additional information makes troubleshooting much easier.
Understanding Encode and Decode Engines
Many users assume GPU utilization alone tells the whole story.
In reality, GPUs contain specialized hardware engines.
For example:
A video editor exporting a 4K video might use:
- Low 3D utilization
- High Video Encode utilization
Meanwhile, someone streaming YouTube could see:
- Low GPU utilization
- High Video Decode activity
Mission Center separates these workloads, helping users understand how applications actually use GPU resources.
AI and Machine Learning Benefits
Artificial intelligence workloads have become increasingly common on Linux desktops.
Developers running local inference models often need to monitor:
- GPU memory
- GPU utilization
- Temperature
- Power consumption
Mission Center provides much of this information within one interface, reducing the need for vendor-specific monitoring utilities during day-to-day development.
4. Improved Memory Monitoring
Memory management remains one of Linux’s greatest strengths.
However, many users struggle to understand advanced concepts like:
- Swap
- zRAM
- zSwap
- Memory compression
Mission Center 1.2.0 improves memory reporting by exposing these technologies more clearly.
Users can now monitor:
- Physical RAM
- Swap usage
- zRAM
- zSwap
- Per-process swap statistics
This makes diagnosing memory pressure much easier.
Why zRAM Matters
Modern Linux distributions increasingly enable zRAM by default.
Instead of writing inactive memory pages directly to disk, Linux compresses them in RAM.
Benefits include:
- Faster application switching
- Reduced SSD writes
- Improved responsiveness
- Better multitasking
Mission Center allows users to verify that these features are functioning correctly.
Better Disk Monitoring
Storage monitoring has also improved.
Instead of showing only overall drive usage, Mission Center now displays:
- Individual partitions
- Used capacity
- Available space
- Utilization percentages
This information helps users quickly identify which partition is filling up.
For systems with separate root, home, boot, or data partitions, this improvement is especially valuable.
Faster Graph Rendering
Performance monitoring software should never become a performance problem itself.
Mission Center developers have optimized graph rendering to reduce overhead.
Benefits include:
- Smoother animations
- Faster refresh rates
- Better responsiveness
- Lower CPU usage
These improvements become noticeable during prolonged monitoring sessions where graphs continuously update.
Better Packaging Across Linux Distributions
Mission Center 1.2.0 also improves software distribution.
Recent updates include:
- Updated Snap package
- Core24 support
- Smaller AppImage
- Reduced dependency footprint
- Improved installation experience
These packaging improvements simplify deployment across Ubuntu, Fedora, Arch Linux, openSUSE, Debian, and many other distributions.
Mission Center Fits Modern Development Workflows
Today’s developers rarely work on a single machine. A common setup includes a Linux laptop for coding and testing, alongside a cloud-hosted virtual machine for resource-intensive builds, Windows-only software, or long-running services.
In this scenario, Mission Center helps users monitor the performance and battery efficiency of their local Linux system, while 99RDP’s Windows VPS solutions provide a stable, always-on remote environment for demanding workloads. Developers can keep build servers, automation tools, and remote desktop sessions running in the cloud without overloading their local hardware.
This hybrid approach offers several advantages:
- Reduced strain on laptop resources during intensive tasks.
- Better battery life by offloading heavy workloads.
- Access to Windows-specific tools from any location.
- Reliable remote environments for testing and collaboration.
- Improved productivity with an always-available development workspace.
Rather than replacing local development, remote infrastructure complements it, allowing users to work more efficiently across multiple platforms.
Mission Center vs. Other Linux System Monitoring Tools
Choosing the right system monitor depends on your workflow. While Linux offers several excellent monitoring applications, each has different strengths. Mission Center 1.2.0 stands out by combining detailed hardware metrics with a polished, user-friendly interface that works well for both beginners and advanced users.
Mission Center vs. GNOME System Monitor
GNOME System Monitor has long been the default monitoring application for GNOME desktops. It provides essential information about running processes, CPU usage, memory consumption, and storage.
However, it focuses primarily on process management rather than hardware analytics.
GNOME System Monitor Strengths
- Lightweight
- Simple interface
- Excellent process management
- Installed by default on many distributions
Where Mission Center Goes Further
Mission Center 1.2.0 offers features that GNOME System Monitor does not provide natively, including:
- Battery health monitoring
- Battery discharge history
- CPU power draw reporting
- GPU encode and decode metrics
- Modern hardware graphs
- Per-partition storage statistics
- Memory compression (zRAM and zSwap) insights
For users interested in hardware performance rather than simply terminating applications, Mission Center provides significantly richer information.
Mission Center vs. KDE System Monitor
KDE System Monitor is one of the most configurable monitoring applications available for Linux.
It offers:
- Highly customizable dashboards
- Extensive sensor support
- Flexible widgets
- Plasma desktop integration
However, its large number of customization options can feel overwhelming for users who simply want immediate visibility into system performance.
Mission Center takes a different approach.
Instead of requiring users to build dashboards manually, it presents carefully designed graphs that are useful immediately after installation.
Mission Center vs. htop
For decades, htop has been a favorite among Linux administrators.
Its advantages include:
- Extremely low resource usage
- Fast keyboard navigation
- Process filtering
- Terminal-based operation
- SSH compatibility
However, htop intentionally focuses on processes rather than complete hardware visualization.
Mission Center complements htop instead of replacing it.
Many administrators use:
- htop for process management
- Mission Center for graphical hardware monitoring
Together they provide an excellent troubleshooting toolkit.
Mission Center vs. btop
The popularity of btop has grown rapidly because it combines terminal efficiency with attractive visualizations.
btop provides:
- CPU graphs
- Memory graphs
- Network monitoring
- Process management
- Disk statistics
Mission Center differentiates itself by emphasizing desktop usability.
Advantages include:
- Native GTK4 interface
- Mouse-friendly controls
- Better battery analytics
- Rich GPU information
- Hardware sensor integration
- Modern desktop appearance
Users who spend most of their time inside a graphical environment may find Mission Center more convenient for continuous monitoring.
Why Mission Center Appeals to Laptop Users
Desktop computers generally prioritize raw performance.
Laptops require a balance between:
- Performance
- Battery life
- Temperature
- Noise
- Mobility
Mission Center 1.2.0 addresses these priorities by exposing power-related metrics that many traditional monitoring applications overlook.
For example, a software developer working remotely can immediately determine whether:
- A browser tab is consuming excessive CPU resources.
- A background synchronization service is draining the battery.
- A recent software update increased processor power consumption.
- GPU acceleration is functioning correctly during video playback.
These insights help users optimize battery life without trial and error.
Real-World Use Cases
Software Development
Compiling large applications often stresses both CPU and memory.
Mission Center allows developers to monitor:
- Processor utilization during builds.
- CPU temperatures under sustained workloads.
- Memory usage while running containers.
- GPU acceleration during development.
- Battery impact during mobile coding sessions.
Developers can compare different compiler options and identify resource bottlenecks more effectively.
DevOps and Cloud Engineering
Infrastructure professionals frequently work with:
- Docker
- Kubernetes
- Virtual machines
- Remote servers
- Continuous integration pipelines
Mission Center provides immediate visibility into how these workloads affect local system resources.
For example, running multiple Kubernetes clusters locally may increase RAM usage while leaving CPU utilization relatively low. Seeing these trends in real time helps engineers allocate resources more efficiently.
Content Creation
Video editors and graphic designers often rely on GPU acceleration.
Mission Center helps monitor:
- GPU utilization
- Video encode activity
- Video decode activity
- CPU temperatures
- Memory consumption
This information makes it easier to diagnose rendering slowdowns or determine whether hardware acceleration is being used effectively.
Students and Educators
Students learning Linux frequently encounter concepts such as:
- Swap memory
- CPU utilization
- GPU acceleration
- Storage partitions
- Battery health
Mission Center presents these concepts visually, making them easier to understand than raw command-line output.
Installation Guide
Mission Center supports several installation methods, allowing users to choose the package format that best matches their Linux distribution.
Ubuntu
Users can install Mission Center using the Snap package or AppImage. The updated Snap package now targets Core24, improving compatibility with modern Ubuntu releases.
Fedora
Mission Center integrates well with Fedora Workstation and can be installed using Flatpak or distribution packages where available.
Arch Linux
Arch users can install Mission Center from the official repositories or the Arch User Repository (AUR), depending on package availability.
Universal Options
Mission Center also provides:
- Flatpak
- AppImage
- Source code for manual compilation
These options ensure broad compatibility across most modern Linux distributions.
Building a Modern Development Environment
Today’s professionals often combine local Linux desktops with cloud-hosted infrastructure to create flexible development environments.
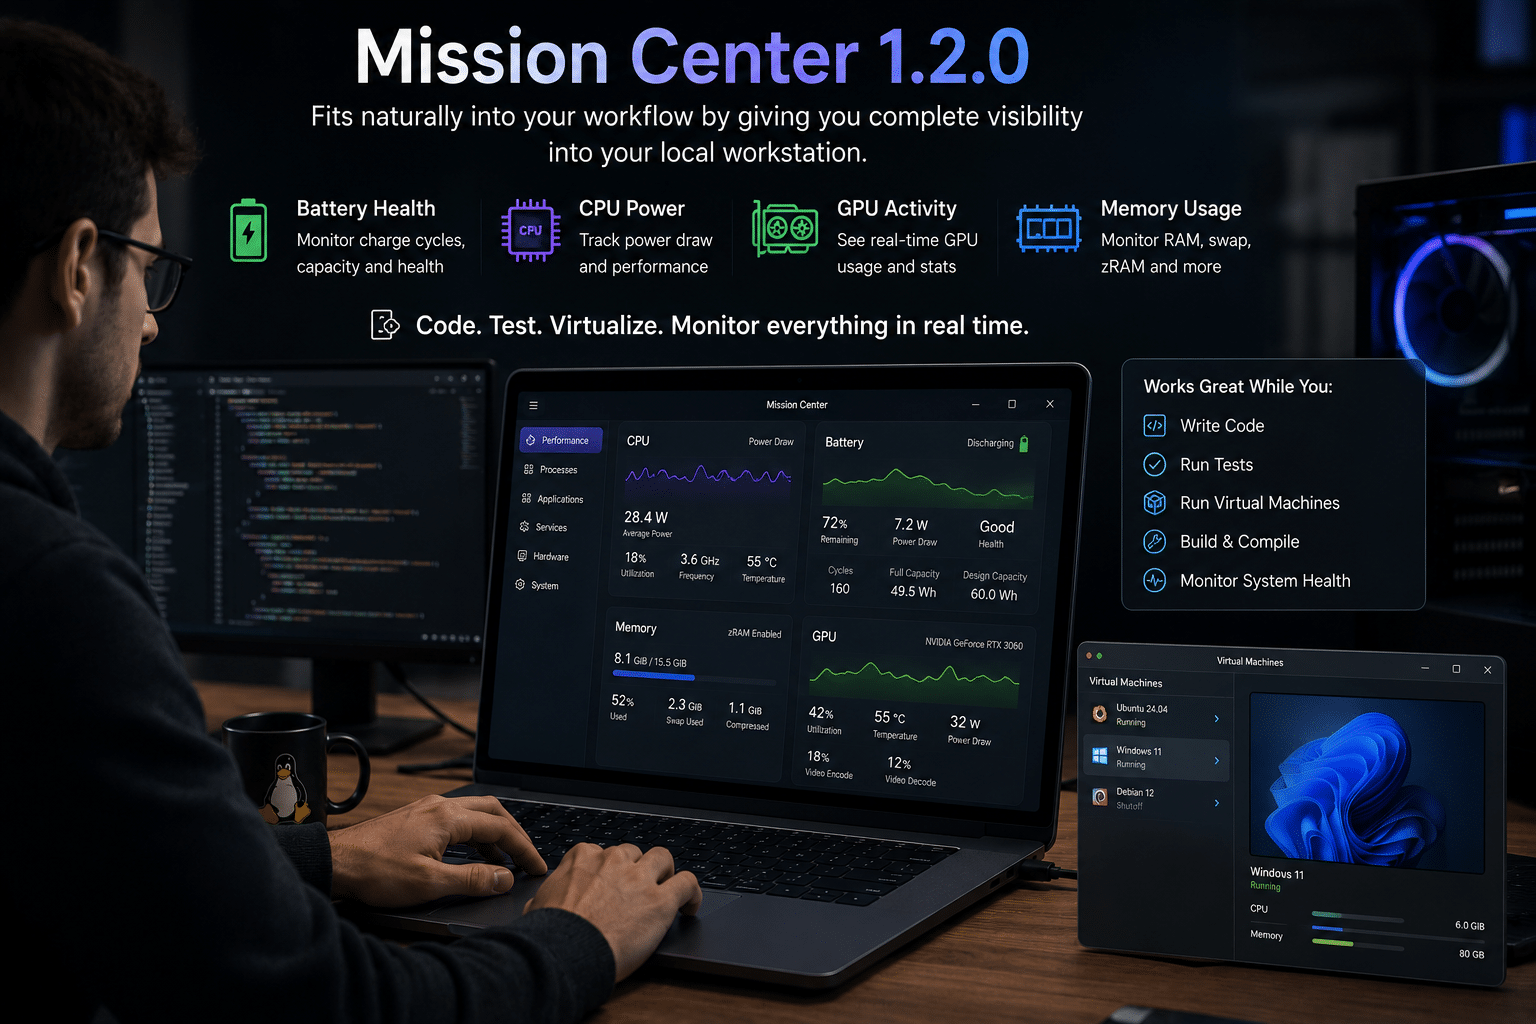
Mission Center 1.2.0 fits naturally into this workflow by giving users complete visibility into the performance of their local workstation. They can monitor battery health, CPU power consumption, GPU activity, and memory usage while coding, testing, or running virtual machines.
For tasks that require additional computing resources or Windows-specific software, 99RDP’s Windows VPS and Remote Desktop services provide a practical extension of the local environment. Developers can offload long-running builds, automation jobs, browser testing, and remote application hosting to a secure cloud-based Windows VPS, reducing the load on their local Linux machine.
This combination offers several benefits:
- Keep your Linux laptop responsive by moving heavy workloads to a remote VPS.
- Access Windows-exclusive tools without maintaining a separate physical PC.
- Run development, testing, or automation tasks continuously on an always-on remote server.
- Improve mobility by accessing your workspace securely from virtually anywhere with an internet connection.
- Scale your computing resources as project requirements grow.
Rather than viewing local and cloud computing as competing approaches, many professionals now use them together. Mission Center provides the visibility needed to optimize the local system, while a reliable remote platform like 99RDP adds flexibility, uptime, and additional computing capacity.
Expert Tips for Getting the Most from Mission Center
To maximize the value of Mission Center 1.2.0:
- Enable supported hardware sensors to unlock additional monitoring metrics.
- Compare CPU power draw before and after installing major software updates.
- Monitor battery health regularly to detect long-term degradation.
- Watch GPU encode and decode graphs when editing videos or streaming media.
- Review partition usage periodically to avoid unexpected storage shortages.
- Keep Mission Center updated to benefit from ongoing hardware support and performance improvements.
EXPLORE MORE ; Linux Lite 8.0 vs Ubuntu 26.04 LTS
READ OUR BLOGS


